Water the new oil 3.3 billion liters of water lost every day due to leakages
Keep water under public ownership
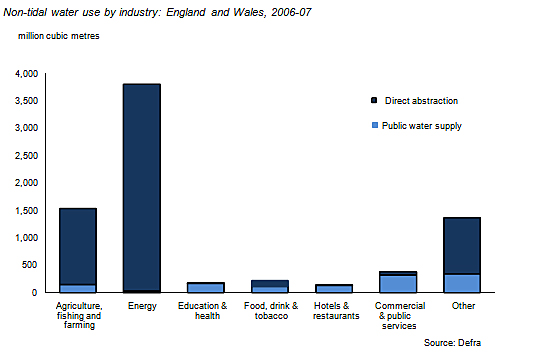
The service sector accounted for the largest proportion of public water supply,
using 56 per cent (709 million cubic meters) of water used by industry in
2006-07. The manufacturing industry accounted for 28 per cent (357 million cubic meters) and agriculture12 per cent (149 million cubic meters).
Experts at this week's World Water Week forum in the Swedish capital are
increasingly talking of fresh water as "the new oil", a finite resource that is
running out in some areas and will become more and more expensive with a
knock-on impact on consumer prices.
Marks & Spencer is working with WWF to calculate the water footprint of its
entire food and clothing ranges. M&S's technical director, David Gregory, said
the availability of water over the next decade was already a key part of the
company's strategic decisions about where to source food for its stores.
"We are already in discussion with WWF about our decisions about where to grow
crops in the future," he said.
Sainsbury's agronomist, Debbie Winstanley, confirmed that water would be "on
every agenda in sourcing food".
The Guardian goes on to say
The study makes the first attempt to measure the UK's total "water footprint"
and highlights the extent to which our imports come from countries which are
running out of fresh water. It calculates that:
· Average household water use for washing and drinking in the UK is about 150
litres a person daily, but we consume about 30 times as much in "virtual water",
used in the production of imported food and textiles;
· Taking virtual water into account, each of us soaks up 4,645 litres a day;
http://www.guardian.co.uk/environment/2008/aug/20/water.food1
NB (This does sound a bit extreme and on the verge of being virtually improbable)
Defra Report;
Approximately 6.3 billion cubic metres of water are used annually by businesses
in England and Wales. Electricity supply accounted for 60 per cent of the total
water used in 2006-07, most of it abstracted directly from surface sources. The
fish farming industry abstracted 20 per cent of the total and the manufacturing
sector accounted for 15 per cent.
This chart does not include water abstracted for household use. Households inEngland and Wales account for approximately two thirds of public water supply.
http://www.defra.gov.uk/statistics/environment/green-economy/scptb10-wateruse/
What is the water used for?
What the water is used for depends on the country.
The pie charts below show the difference in water usage in four countries.


In general LEDCs (like Bangaldesh and Malawi) will have most of their water used in agriculture (farming) and little in industry or domestic use. Bangladesh has farming as a large part of its economy so a large percentage of their water is used for that purpose.
MEDCs (like the UK) have a more significant use of water for domestic reasons. MEDCs also tend to have a higher percentage for industrial use.
There are exceptions. The USA is an MEDC, but it still has a high amount of water used for agriculture because there is also lot of farming across the country.
The % share of total water usage:
For other information see
No comments:
Post a Comment